Article
Making a Geographic Heatmap with Python
Updated: Oct 21, 2018
Recently, I wanted to map some spatial data I had in Python and wondered what free Python tools were currently available. Turns out, there are many options, especially if you are just looking for a chloropleth. To name a few packages: vincent, bokeh, plot.ly, of course matplotlib, and even just hacking together an SVG file without any GIS or projections needed: flowingdata. Sidenote, if you are more comfortable writing javascript and/or your data is already in js, check out all the other chloropleth tutorials on flowingdata.
Instead, I chose folium because:
- it's still actively maintained (vs. vincent)
- free (vs. plot.ly)
- relatively painless to use (compared to say, matplotlib)
- will show inline in jupyter notebooks AND outputs HTML/js that can be iframed or inserted into web pages
- built-in support for geographic heatmaps (unlike all? the others I've mentioned)
Notebook and Data
All the code here and the data is available in a github repo.
git clone https://github.com/mikecunha/pygeo_heatmap.git
Requirements
Python Packages
folium
geopandas for adding other geojson layers or shapefiles to the map (district
boundry here)
pandas too, but geopandas will install it for you, used here for
convenient loading of tabular data
pip install folium geopandas
Data
I'm using campaign contribution data for my local representative exported from followthemoney.org. I will cover how I aggregated and augmented those data with spatial information (geocoding) in another post. Here's what the data look like:
| City | State | lat | lon | Amount |
|---|---|---|---|---|
| WASHINGTON | DC | 38.907192 | -77.036871 | 1918808.40 |
| ROCHESTER | NY | 43.160000 | -77.610000 | 195067.39 |
| ALEXANDRIA | VA | 38.804835 | -77.046921 | 185438.32 |
| ARLINGTON | VA | 38.879970 | -77.106770 | 138900.00 |
| NEW YORK | NY | 40.710000 | -73.990000 | 130620.00 |
I also used a shapefile from census.gov to add a border around my congressional district using geopandas. You can download a shapefile of all the congressional districs from this page on census.gov or just run:
curl -O http://www2.census.gov/geo/tiger/GENZ2015/shp/cb_2015_us_cd114_20m.zip
Loading it as geojson in python and filtering out all but the district I wanted was easy using geopandas:
import geopandas as gpd

congr_districts = gpd.read_file('zip://'+'cb_2015_us_cd114_20m.zip')
congr_districts.crs = {'datum': 'NAD83', 'ellps': 'GRS80', 'proj':'longlat', 'no_defs':True}

district23 = congr_districts[ congr_districts.GEOID == '3623' ]  # 36 = NY, 23 = District

# convert it to the projection of our folium openstreetmap
district23 = district23.to_crs({'init':'epsg:3857'})
Setting the datum and projection are important and I found the correct values by digging around the census.gov site. I believe I found the exact values in this pdf.
Dan Nguyen's blog also had a useful article about working with shapefiles from census.gov using geopandas.
Making the Map
Folium makes this pretty easy:
import pandas as pd
import folium
from folium.plugins import HeatMap

for_map = pd.read_csv('campaign_contributions_for_map.tsv', sep='\t')

max_amount = float(for_map['Amount'].max())

hmap = folium.Map(location=[42.5, -75.5], zoom_start=7, )

hm_wide = HeatMap( list(zip(for_map.lat.values, for_map.lon.values, for_map.Amount.values)),
                   min_opacity=0.2,
                   max_val=max_amount,
                   radius=17, blur=15,
                   max_zoom=1,
                 )

folium.GeoJson(district23).add_to(hmap)
hmap.add_child(hm_wide)
And then to save the generated leaflet map to file:
hmap.save(os.path.join('results', 'heatmap.html'))
After you have saved the generated html to file you can insert it in other web pages like I did for this blog with an iframe:
<iframe src="heatmap.html" style="border: 0; width:100%; height:500px;"></iframe>
Setting Parameters
For the example map above, I had to experiment with the HeatMap parameters quite a bit before I
thought the map accurately represented the data while still being useful at all levels of zoom. I
found the parameter descriptions on the site for the
leaflet-heatmap.js extension
very helpful.
Defaults

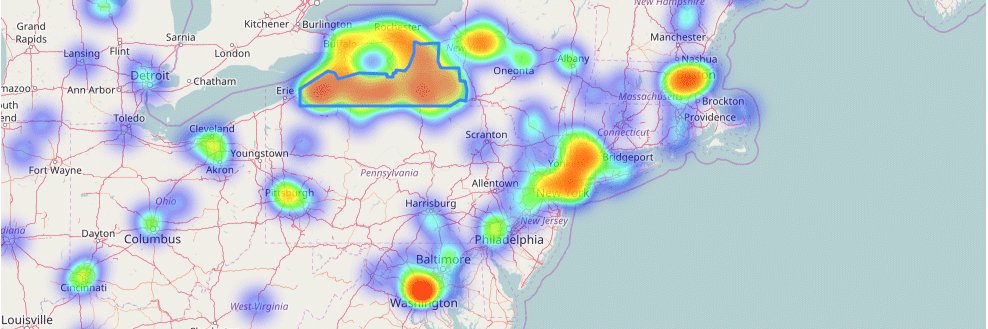
max_val
The data I'm passing in hasn't been normalized to a range of (0-1), so setting the max value
parameter is required. Here's what it looks like with that change made:

radius, blur, and max_zoom
For me, these were the next most obvious parameters to play with. radius and blur are pretty
self explanitory. The effects of max_zoom were not intuitive for me but had a big impact for
these data: it's the zoom level where the points reach maximum intensity. The smaller the number,
the more zoomed out you can be while still displaying full intensity. I found that setting this
number higher than the level the map was currently zoomed to tended to hide very hot individual
points whereas large groups of low intensity points were less affected.
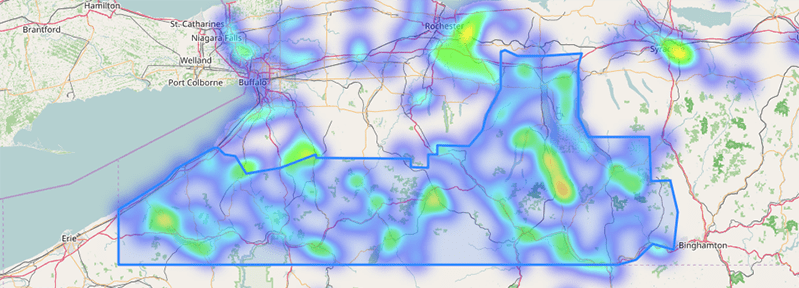
min_opacity
This was the most important parameter to tune for these data. It was responsible
for making small campaign contributions look almost comparable to the intensity of all the PAC
contributions coming from Washington DC. DC was an outlier in the example data above with an
order of magnitude more campaign money than any other location. No other point on the heatmap
should appear as "hot" as DC does. Reducing the the min_opacity to as close to zero as
possible while still mantaining some visibility of smaller donations fixed this:

Static Images from Interactive Maps
By Hand
The easiest way to get a static image of one of these generated interactive leafleft maps seems
to be just a good old screenshot. Command-Shift-4 in OSX will let you drag a box with your mouse
of the view you want and save it as a png to your desktop. Print-Screen works on Windows if you
then paste what's in your clipboard into a program that can crop and save to an image file. If you
are using linux... I bet you don't need any tips from me 🙂.
Programmatically
At the time I'm writing this there does not appear to be a native way in folium to save to an
image file. This github issue
discusses the topic and puts forth a couple of options. The issue is marked closed and is more
than a couple of years old. Here's a summary of the two options mentioned:
Cutycapt
This is a command-line utility that you would need to install, along with some dependencies.
You could then save images from Python with something like:
import os
import subprocess
outdir = "screenshots" # this directory has to exist..
folium_map.save("tmp.html")
url = "file://{}/tmp.html".format(os.getcwd())
outfn = os.path.join(outdir,"outfig.png")
subprocess.check_call(["cutycapt","--url={}".format(url), "--out={}".format(outfn)])
I didn't like the dependencies for cutycapt, but I can recommend:
Selenium
Selenium is a tool for automating browsers that has a Python package that makes it quite easy.
I like using it in combination with the PhantomJS browser on headless
machines like servers. A starting point:
import os
import time
from selenium import webdriver

fn='testmap.html'
tmpurl='file://{path}/{mapfile}'.format(path=os.getcwd(),mapfile=fn)
folium_map.save(fn)

browser = webdriver.Firefox()
browser.get(tmpurl)
time.sleep(5)  #Give the map tiles some time to load
browser.save_screenshot('map.png')
browser.quit()